You can download the event report that provides information about each event you have hosted. Event report will be available 24 hours after event ends. You can gain insight into usage trends by event report.
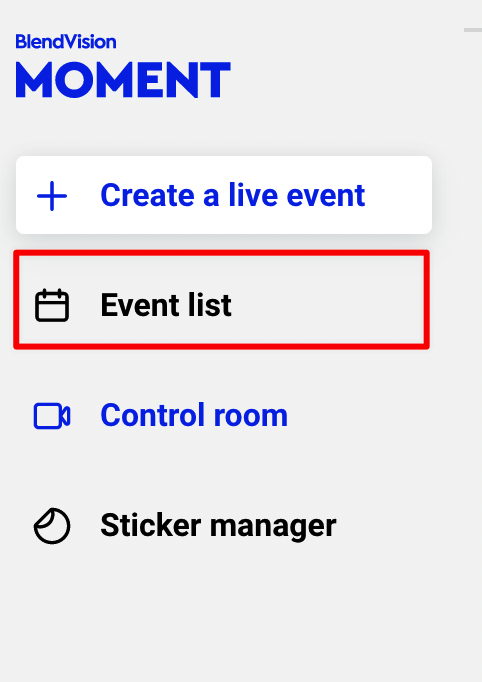
1. Click "Event List" button in the left sidebar and all the created events will be listed.
2. There is an event analytics button on the right side of the event list. The button is available when the event has data (24 hours after the event ends).
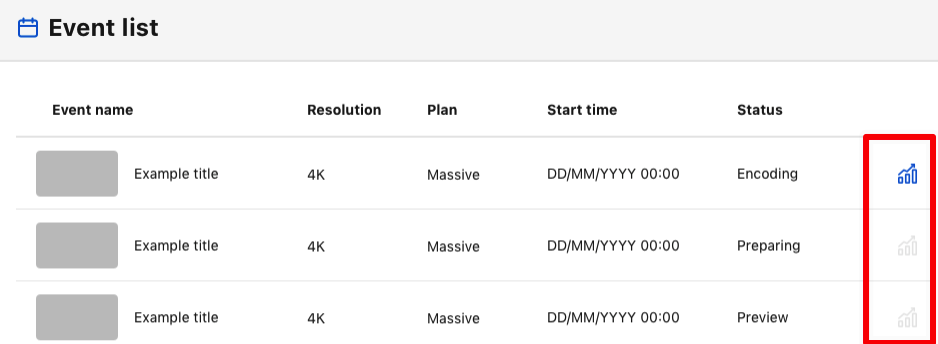
3. Click the event you want to review event performance.
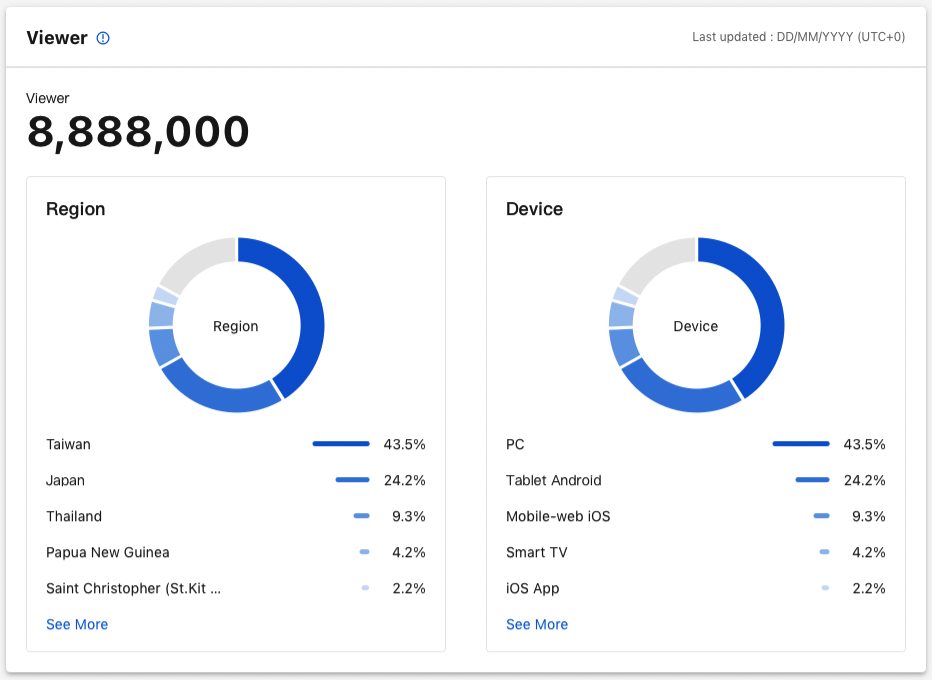
4. Viewer Report:
- The calculation of the viewer is based on the unique deviceID for viewing this live event or VOD. The report will offer detailed information about your users. For instance, who are your users? Or, where are they watching from?
- Event report will be available 24 hours after the live event ends.
- All dates are in UTC+0.
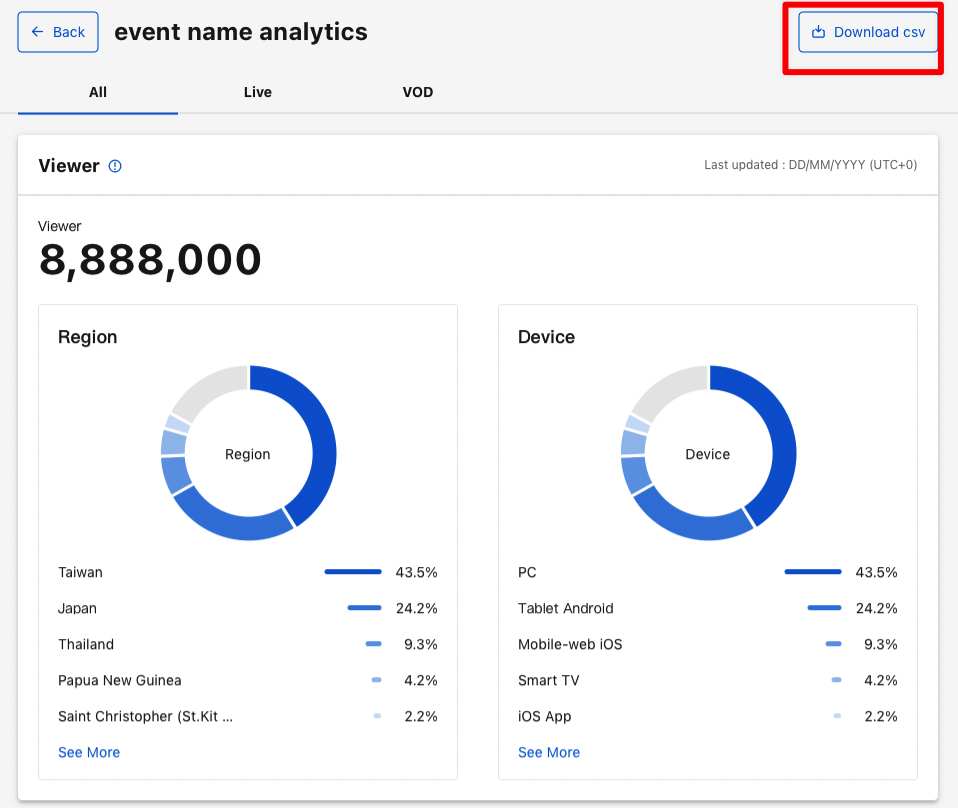
5. Click "Download Excel" button in the upper right corner to download Excel file for offline analysis.
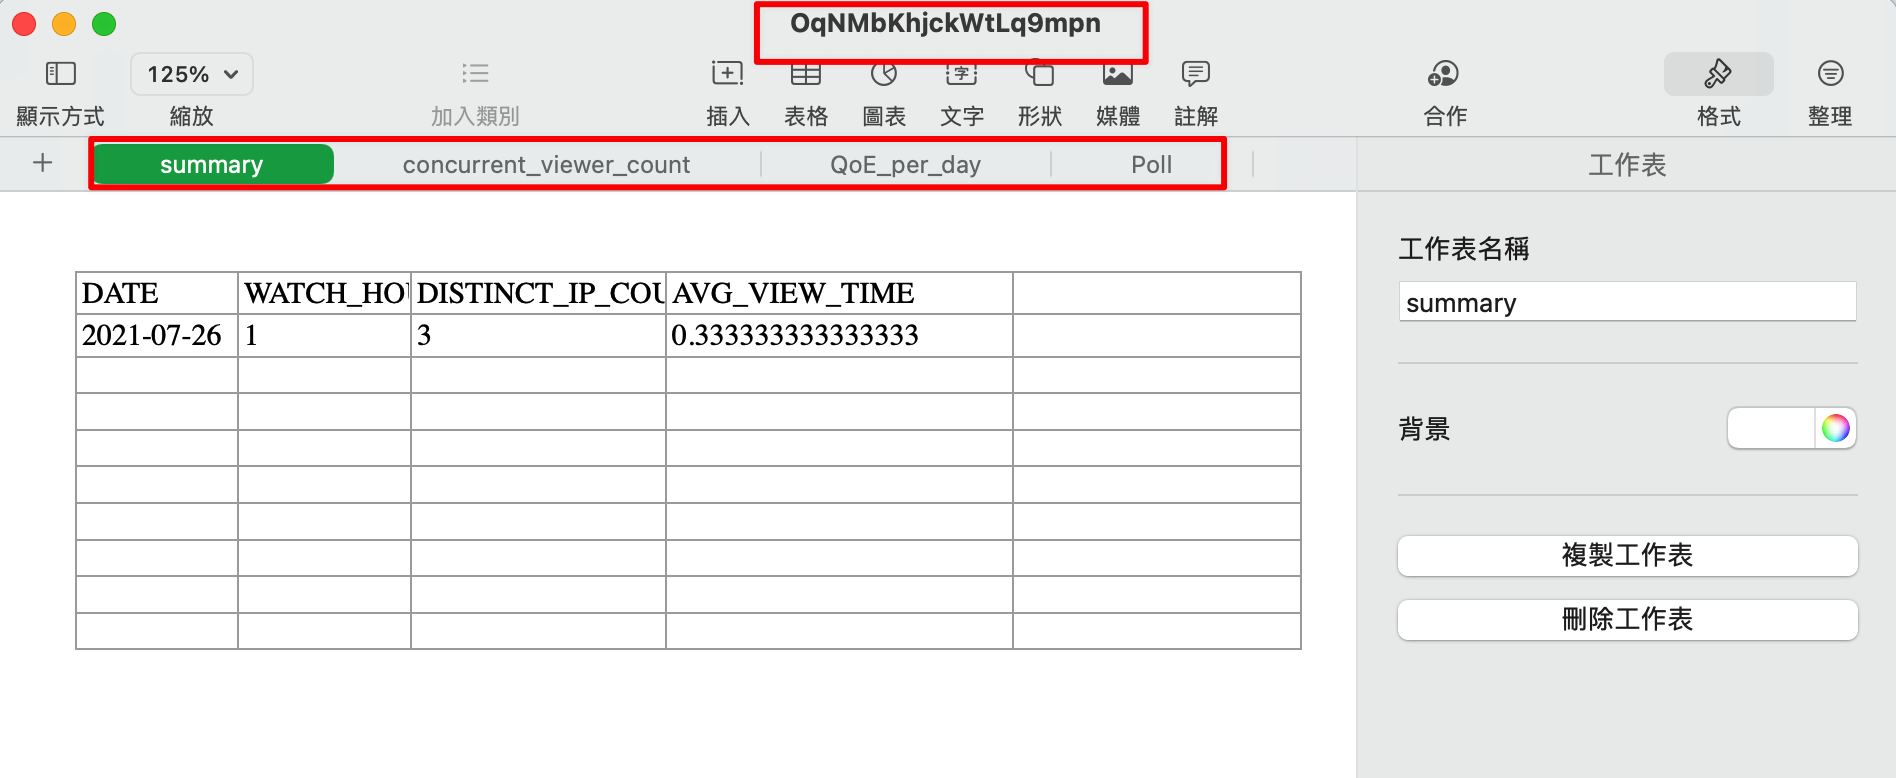
- File name: The file name of the report will be the string after last slash in the link of your event on CMS, as the example below:
https://cms.live.kkstream.io/live/control-rooms/OqNMbKhjckWtLq9mpn
|
The string after last slash in the link, OqNMbKhjckWtLq9mpn, will be the file name when you download the report.
- The report contains detailed information about the event you hosted. Each report includes 6 worksheets:
- summary
- concurrent_viewer_count
- QoE_per_day
- Poll
- Viewer_region
- Viewer_device
- The following table shows the detailed summary of an event:
|
Worksheet |
Items |
Description |
|
summary |
DATE |
Refer to the event date |
|
WATCH_HOUR |
Show the total watch hours users watched live event(Unit: hours) |
|
|
UNIQUE_DEVICE_COUNT |
Show the amount of views based on IP, each view represents a distinct IP, which pulls content segments. |
|
|
DISTINCT_IP_COUNT |
Show the amount of distinct IP which watched live event (on the same wifi, multiple users would be counted as 1 IP) |
|
|
AVG_VIEW_TIME |
The average of watch time (Unit: hours) (=WATCH_HOUR/DISTINCT_IP_COUNT) |
|
|
concurrent_viewer_count |
DATE_TIME |
Refer to the event date |
|
AVG_VIEWER_COUNT |
Show the concurrent users of every 3 mins by calculating the download times of segments. |
|
|
QoE_per_day |
DATE |
Refer to the event date |
|
PROFILE |
List all the resolutions of live event |
|
|
SEG_COUNT |
Show the total watched segments of the resolution |
|
|
RATIO |
The percentage of watched segment for each resolution (=Each profile seg_count/Total amount of segments) |
|
|
ROUNDED RATIO |
Round the number of "RATIO" column to the nearest integer |
|
|
Poll |
DATE |
Refer to the event date |
|
Poll title |
Refer to the poll details |
|
|
Total votes |
Add up all votes for each option |
|
|
Votes |
The number of votes for each option |
|
|
Votes% |
The percentage of votes for each option (=The number of votes for each option / Total votes *100%) |
|
|
Viewer_region |
REGION |
List the area where the user’s UNIQUE_DEVICE is located |
|
UNIQUE_DEVICE_COUNT |
Show amount of unique deviceID who watched live event per region |
|
|
Viewer_OS |
Device |
List the OS which the user’s device connects to the content |
|
UNIQUE_DEVICE_COUNT |
Show amount by distinct IP which watched live event per OS |