You can check the number of concurrent users to monitor your live event performance during event.
1. Click "Control room" button in the left sidebar and all the created events will be listed.

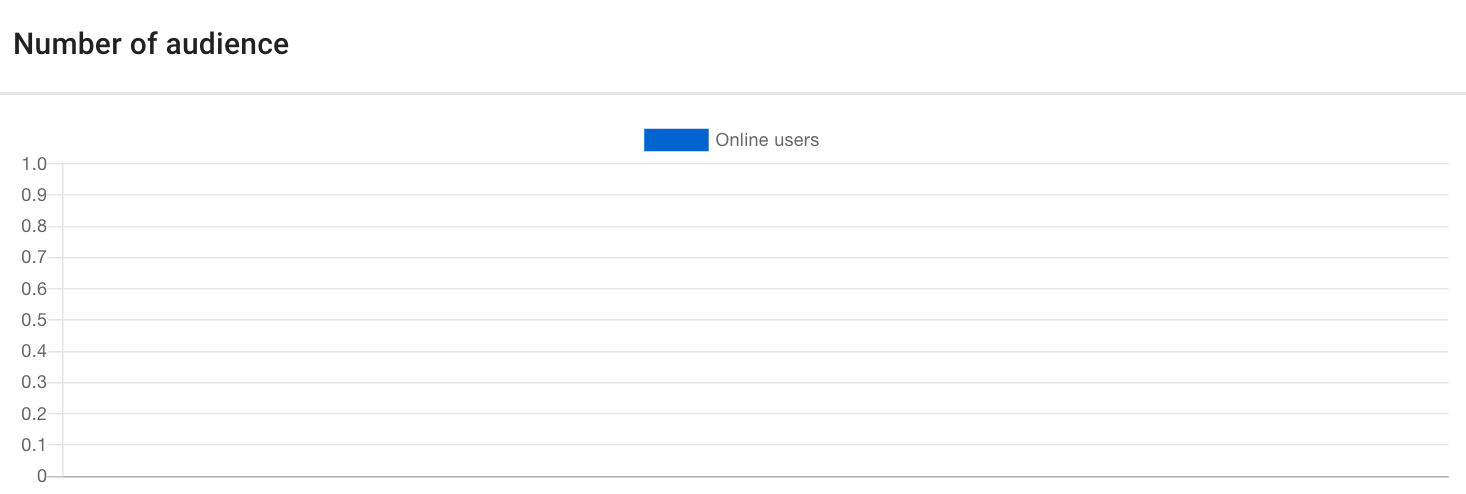
2. Click the event you want to monitor, and you can find the line graph in Number of audience section below KKStream player.
The following information can be tracked from the line graph which will be updated every 3 mins.
- The horizontal axis represents time.
- The vertical axis represents the number of online users.
3. On the event data tab, you can monitor the signal health by monitoring the charts of frame rate/ bitrate.
- Time: For Live and Simulive events, you can start to observe the health of the signal from preview status to live end.
-
If the event is a direct VOD event or the status turns archived, the chart would display no data like the chart of concurrent audience does.
-
The X-axis of the charts are displayed in 1-minute intervals, total length displays from preview to live end. The maximum display length is 24 hours.
-
The Y-axis represents avg. Frame rate/Bitrate(in), and the main and backup signal are both being monitored if you set up 2 signals appropriately.
- Bitrate(Input): The amount of data flowing into the MediaLive. If it is 0 (or very low 0), it means that there is no data input
- Frame Rate: According to the input format, this value needs to be ~30fps/~60fps; if it is 0, it means that there is no valid video data input.
- A health signal should be maintained on a certain level and should not dramatically drop, once it happens, please check out your signal to examine whether it's disconnected or not.
- If there is data on both charts, but the figure is strange, e.g. beyond the range of 2-20Mbps, it would possibly be the problem of signal settings, or the internet circumstances is not steady, and therefore have negative effect on signal.